Designing financial pitch deck presentations is a balancing act.
As the presenter, it’s easier to simply copy data from spreadsheets and paste them onto slides. But your audience might find the barrage of numbers overwhelming and hard to understand.
On the flip side, you can try to engage bored audience members with graphics and slide transitions. But use too much and your financial pitch deck might end up looking ill-designed and uninspired.
How do you find the balance between ‘too much information’ and ‘too many distractions’?
Here are a few tips to keep in mind when you’re preparing a financial pitch deck presentation.
Identify the financial data that moves your narrative forward
A financial pitch deck presentation shouldn’t just be about showing off balance sheets, profit-and-loss statements, or market reports.
Consider these questions: What is the story that your audience came to hear? What is the narrative behind your pitch? Are you presenting the story of your company’s successful attempt to meet market challenges? Or are you talking about the promising growth of a start-up client company?
Think of the data you have as details in a story. Identify the scenario and decide which of your data is the most crucial to your story and the audience.
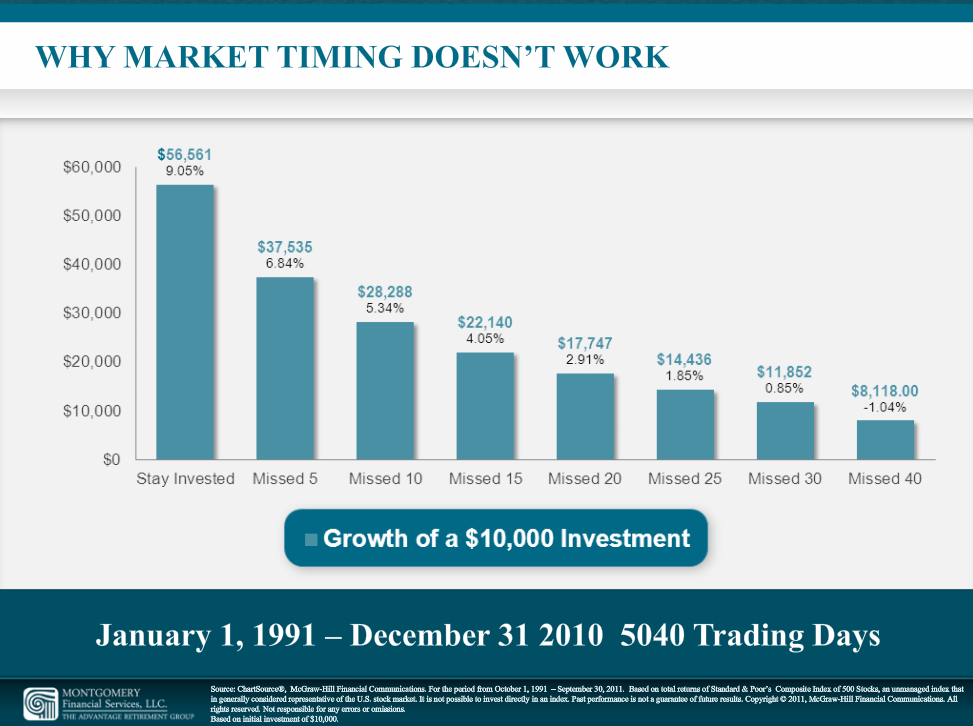
Illustrate numbers through diagrams, charts, and graphs
Once you’ve decided on the most important data, you can begin to translate numbers into illustrations. Doing so will help your audience follow patterns and trends that might otherwise seem confusing.
Visualize your data through diagrams, charts, and graphs. It’s also a great way to condense useful information into one slide. Data that spans several years can be summarized into a bar graph.
Keep text to a minimum
Don’t be tempted to explain your illustrations with ten bullet points each. Instead, according to presentation trainer Dave Paradi, what you can do is to write sentences or ‘headlines’ that summarizes key points in the data.
It’s important to keep the text in your financial pitch deck slides to a minimum. Long-winded paragraphs analyzing your pie charts can prove to be just as overwhelming as the numbers you’ve worked to condense.
Remember: it’s your job to expound on the data you’re presenting. You can’t just let your pitch deck slides do the talking.
Opt for a design that matches content and context
With over 500 million users, most people are probably tired of seeing generic pitch deck templates again and again. Instead of using default templates, get creative by customizing your financial pitch deck slides.
Opt for a design that matches your content and the context of your pitch. For example, you can use color schemes that match your client’s logo if you’re presenting about their financial statements.
Here are a few other things to remember:
1. Font Type & Size
Choose font types that are easy to read. You don’t always have to go for the classic Arial or Times New Roman, but try to avoid blocky and ornate fonts unless they’re big enough to read. Venture capitalist Guy Kawasaki explains that the general rule for font size is 30 points or greater. This font size is readable for most audiences, which makes it safest to use.
2. Contrasting Backgrounds & Colors
The color of your background should contrast with everything else on your slides—from font colors to the colors you use in your graphs. You can’t go wrong with using a dark blue background and white text (like Steve Jobs). You can also opt for a white background with black text. This option is easier to see in a bright room, so you won’t have to dim too many lights during your pitch.
For a time-saving, optimized financial pitches, consider working with professional pitch deck designers. pitchdeck.com has an extensive portfolio of financial pitch deck presentations.
References
“The 10/20/30 Rule of PowerPoint.” Guy Kawasaki. December 30, 2005. Accessed June 16, 2014.
Paradi, David. “Presenting Financial Data: Put Your Numbers on a Diet.” Presentation Xpert. Accessed June 16, 2014.